Navigation
TaskFlow is organised into different applications. Each application has a purpose and you can easily switch between them by clicking on the "App Switcher" icon in the top left-hand corner of the screen. This will display all the applications currently installed on your TaskFlow instance. Click on an icon to go to the application.
...
The control panel adapts to your needs, depending on whether you are viewing a list of records, editing a record, viewing a graph or printing a report. The control panel consists of a left part where you will find your bread crumbs, and create/import/edit/delete and /print/action buttons. The right part consists of your a search bar with search tools and icons for switching between different views. We explain more about searching and different views below.
...
The left hand part of the screen is dedicated to the agent widget. The widget shows your current call, campaigns, call history, scheduled calls and moreand anything else a contact centre agent might need. The agent widget will adapt to your current context and will display information and ask for input as the context changes.
| Info | ||
|---|---|---|
| ||
The agent widget will only show in one browser tab if you have multiple tabs open. |
...
TaskFlow uses different layouts to display data to the user. These are called views and you can switch between them depending on whether you want to view many records, one record or pull a report.
Generally speaking, there are six types of views you will come across:
- Form view (displays a single record)
- List view (displays a list of records)
- Kanban view (displays record cards)
- Calendar view (displays records mapped to a calendar)
- Pivot views (displays your data in a pivot table)
- Graph views (displays your data in a visual graph)
Form views
Introduction
A form view displays a single record together with all of its fields. By default the form view is read-only, i.e. only displaying the fields. If you want to edit the form view, click on the "Edit" button located just underneath the bread crumbs on the control panel. In edit mode, the fields can be changed. Once you are done editing the record, you can click on "Save"; also located just underneath the bread crumbs.
...
Some records have special actions that launch wizards as well as or print reports. If your form view is in read-only mode, these buttons will display next to the "Edit" and "Create" buttons, underneath the bread crumbs.
...
Some records have a specific workflow and the record can be in a specific stateor states. Generally speaking, a record states 's state will display in the top right-hand corner of the form view. Workflow buttons will display in the top left-hand corner of the form view. To guide the user, some workflow buttons will be highlighted.
...
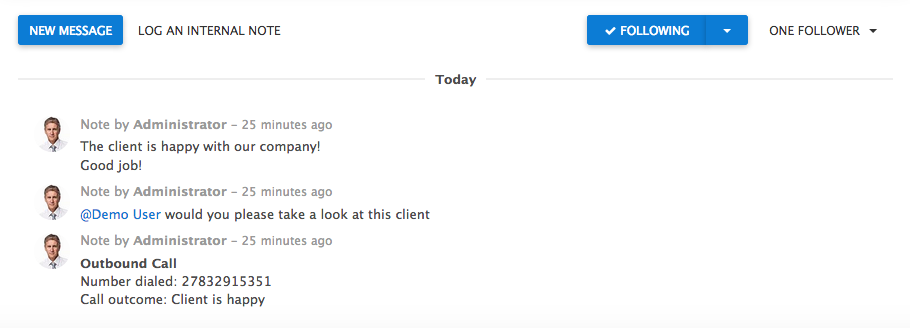
Most form views have a communication thread at the bottom. Emails, calls, SMS and internal communications are conveniently logged in one place. Generally speaking, clicking on "New Message" will send out an email notification to all the followers of the document. Logging an internal note on the other hand will only send out an email notification if you tag someone using the "@" character.
...
List views
Introduction
List views represents represent your data in the form of rows and columns. By default, the list view will show you 80 records at a time, but you can click on the "<" and ">" buttons underneath the search bar to page through your datathe list. If you click on a list item, you will be taken to the record's form view.
...
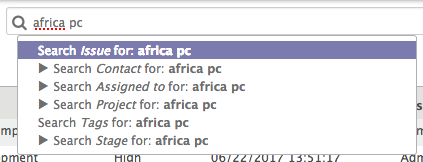
To search, you can start typing inside the search bar. The search bar will expand with a menu that will introduce more options to specify narrow down your inquiry
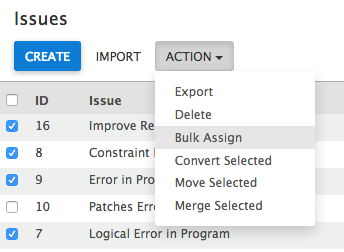
When By selecting items in the list, the print and action buttons will appear in a similar fashion to the form view.
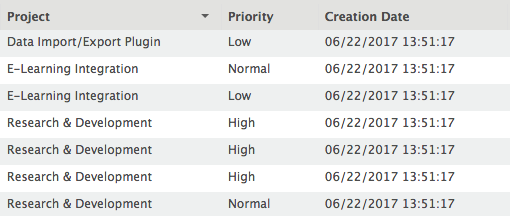
You can sort your data the list by clicking on the column you want to sort byany of the columns.
...
Kanban views
Introduction
Generally speaking, there are three types of Kanban kanban views, each of which has a different purpose:
- Card kanban (displays many records in the form of business cards)
- Swim lanes (displays cards sorted into different columns)
- Dashboards (displays statistics and graphs)
Card kanban
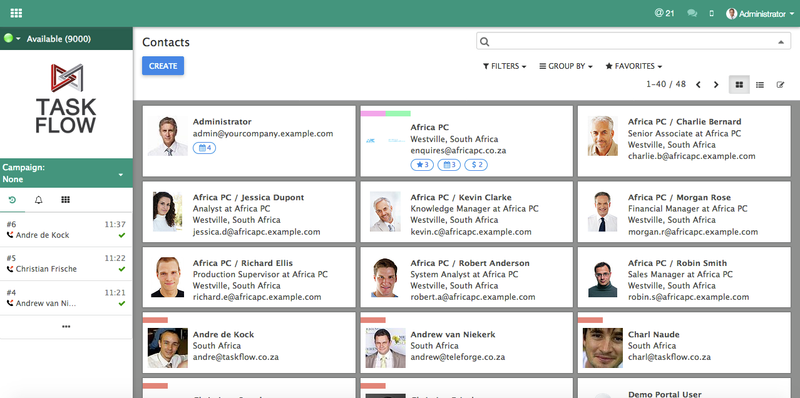
A good example of a card kanban is in the Contacts application. The idea behind it is to organise your data in a business card format, showing you an avatar and some basic information. By clicking on a card you will be taken to the form view of that record.
Swim lanes
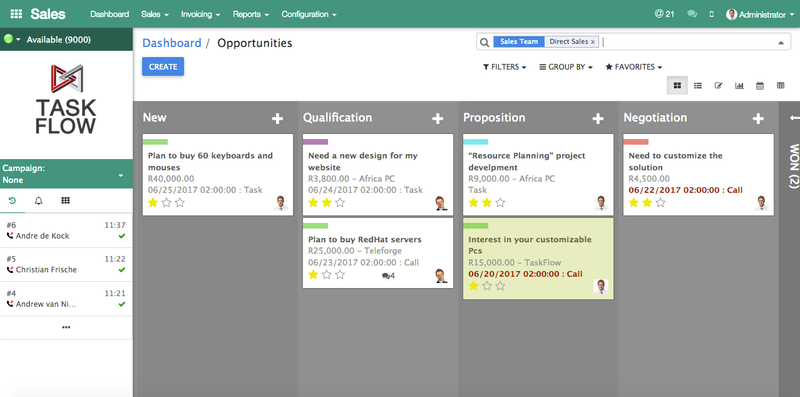
Organise your kanban cards into swim lanes based on some or other stateSwim lanes organise kanban cards by their current position in the workflow. A good example of this type of view is inside the Sales application. Each opportunity has a state so you can track progress and based on this same state, your cards can be represented in different swim lanes. You can easily drag and drop kanban cards into a different swim lane.
Dashboard
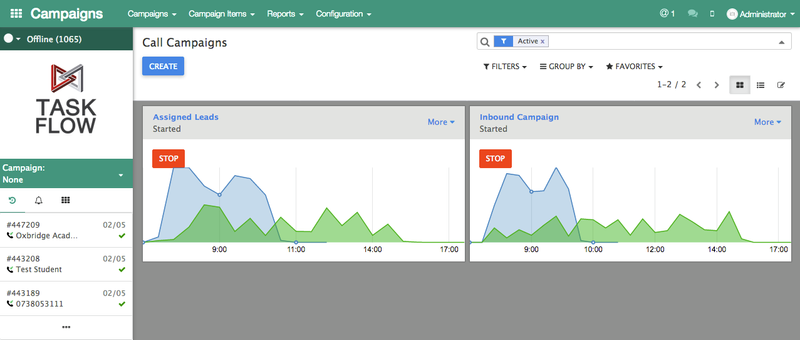
Your data Data can be represented using dashboards which will typically display graphs and stats. Two good examples of this is your call campaigns inside the Campaigns application and your sales teams inside the Sales application.
...
Calendar views
Calendar views show records on a calendar. A good example of this type of view is in the Sales application when viewing opportunities. This view shows the opportunities and plots them according to their next activity date. By clicking on a record, you are taken to the record's form view.
...
| Info | ||
|---|---|---|
| ||
Do not confuse calendar views with the Calendar application. There are many calendar views throughout TaskFlow. Meetings are displayed in a calendar view inside the Calendar application. |
...
Graph views
Introduction
Graph views make it easy for the user to represent massive understand large amounts of recordsdata. There are three different types of graphs throughout TaskFlow. These are: bar chart, pie chart and line graph. A good example of a graph view can be found on opportunities in the Sales application.
Bar chart
The bar chart on opportunities shows us expected revenue on the y-axis and the stage the opportunity is in on the x-axis. The y-axis can be changed by selecting a different measure. You can measure by any number field. The x-axis can be modified by doing a "group - by" on a different field.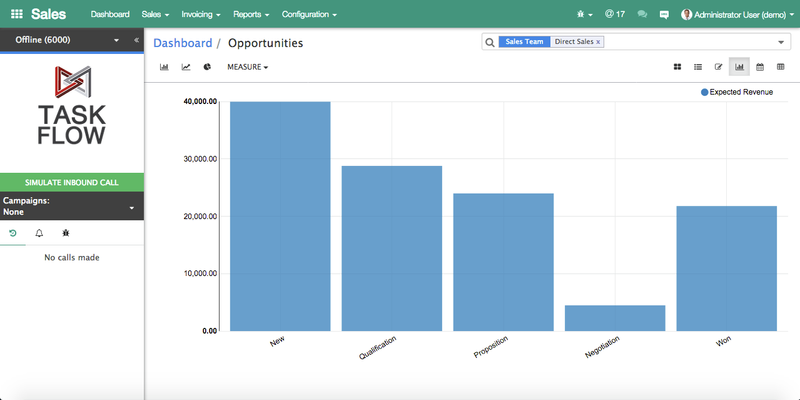
Pie chart
By clicking on the pie chart icon that is located underneath the bread crumbs in the control panel, we see a different view of the opportunities. We can see that most of the opportunities are in the "New" stage and only some are in the "Negotiation" stage.
...
Line graph
A good example of a line graph can be found on outbound calls inside the Voice application. The graph below has a "group - by" on the date created field and the measure is set to count.
...
The data on all of the charts can be manipulated by using the search controls in the control panel. Use "group - by" to change the x-axis on the graphs and the legend in case of pie charts and use the "measure" button located underneath the bread crumbs to manipulate the y-axis.
From the image below you can see the fields that are predefined on opportunities. If the field you are looking for is not in this list, you can click on "Add custom group" and select the field from the list.
...
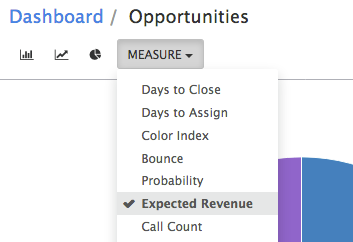
The image below shows all the fields that can be used as measurements on opportunities. Any field that is of number type, can be used.
...
Pivot views
The purpose of pivot views is to have show a 3-dimensional view on your data. The data can be manipulated through the search controls on the control panel, or by clicking on the "+" and "-" signs on the pivot table.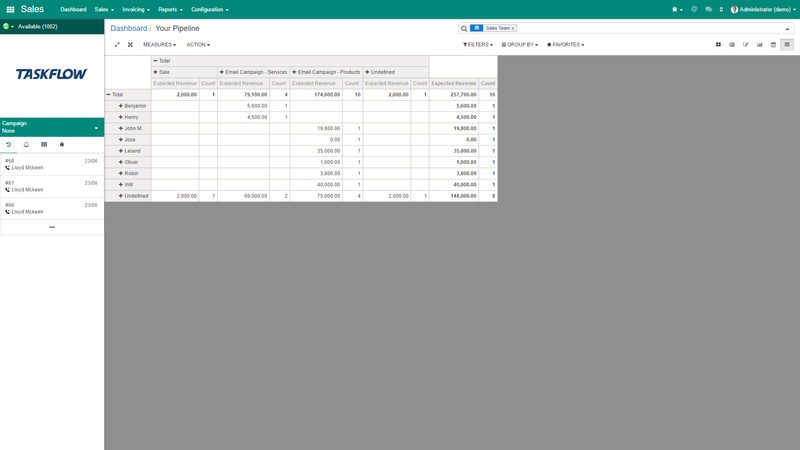
All of the fields available on the model you are viewing data on (in this case opportunities) are available to you to create your a 3-dimensional view. Similar to graph views, you can also select your measurement fields in the "measure" drop down below the bread crumbs on the control panel.
...