Problem
- How do I ensure that my browser's cache is cleared?
- How do I go into debug mode?
Solution
By activating debug mode, hidden content and tools become visible to users. Debug mode is used by administrators to configure TaskFlow . For but for normal users, debug mode is useful to ensure that all of the browser's cache is cleared.
Debug mode using a URL
| Panel |
|---|
|
Follow the steps below
- Log into TaskFlow using your normal user
- Type the following in your browser address bar: https://demo.taskflow.co.za/web?debug=
- Replace the word "demo" with the name of your server instance
|
Debug mode using the UI (Version 2.x)
| Panel |
|---|
|
Follow the steps below
- Navigate to the Settings Dashboard and click on Debug Mode
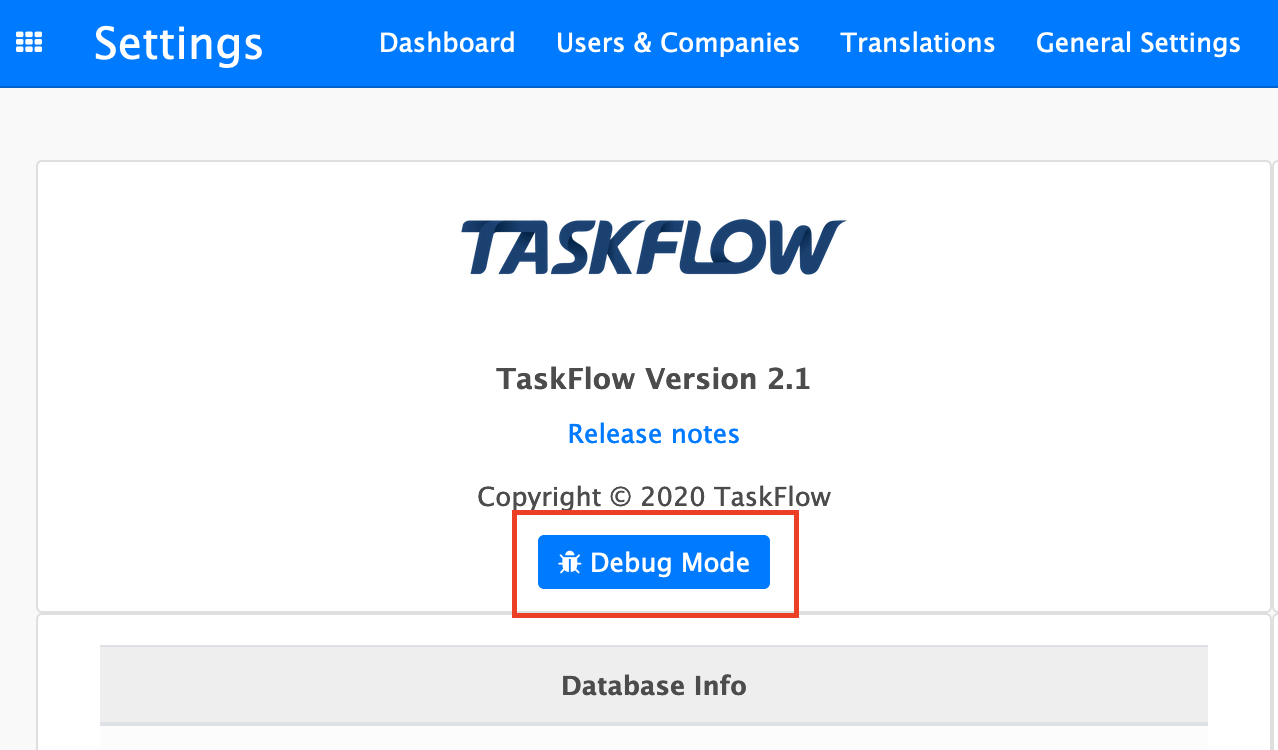 Image Added Image Added
|
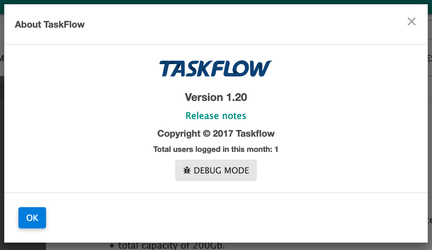
Debug mode using the UI (Version 1.x)
| Panel |
|---|
|
Follow the steps below
- Click on About
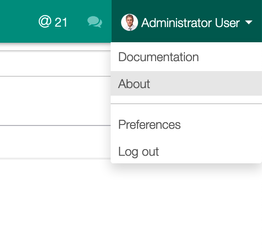 - Click on Debug Mode
|
If none of the solutions solved your issue, please contact us on support@taskflow.co.za and provide us with as much information as possible. Also indicate to us through which articles you have gone through in the troubleshooting guide.
Related articles
| Filter by label (Content by label) |
|---|
| showLabels | false |
|---|
| max | 5 |
|---|
| spaces | com.atlassian.confluence.content.render.xhtml.model.resource.identifiers.SpaceResourceIdentifier@a83 |
|---|
| showSpace | false |
|---|
| sort | modified |
|---|
| reverse | true |
|---|
| type | page |
|---|
| cql | label = "kb-troubleshooting-article" and type = "page" and space = "TW" |
|---|
| labels | kb-troubleshooting-article |
|---|
|
...